OpenAgent Consumer Sentiment Index - 2017 Q1
Johanna is one of the co-CEOs of OpenAgent. She has over 8 years of experience in the real estate industry through her work at OpenAgent and holds a class 2 real estate license in NSW. Previously, Johanna worked at hipages.com.au, Australia's largest trade marketplace, where she built her experience understanding renovations and home improvements for 7+ years.
Learn more about our editorial guidelines.
Forward
Here at OpenAgent, we know the importance of up-to-date market insights.
As Australia’s largest real estate comparison and referral platform, we speak to thousands of homeowners every month who are seeking assistance in selecting the right person to sell their largest financial asset.
We’re always looking for ways to add value for our customers, and we realised that by speaking with such a broad range of homeowners all over Australia, we had the unique ability to capture the market perspectives of one of the most important groups in the real estate ecosystem - home sellers.
In November last year, we began compiling anonymised data capturing the sentiment and market expectations of consumers who were actively looking to sell their property.
Over the fourth quarter of 2016 (November to December) and the first quarter of 2017 (January to March), we collected over 2,600 responses, forming the inaugural cohort for the OpenAgent Consumer Sentiment Report, an ongoing quarterly publication that will track the market expectations of active vendors over time.
As you’ll see below, the inaugural release include home price sentiment at a National, State and Metro level, as well as granular information about why people are selling, and what they see as the key factors driving their local market.
We hope you enjoy our first report, and we look forward to delivering many unique insights in the quarters to come.
Sincerely yours,
Zoe & Marta Co-Founders of OpenAgent
How the Consumer Sentiment Index Works
To build the Consumer Sentiment Index, we ask our vendors the following question:
Where do you expect home prices to be in your area in six months’ time?
Vendors then rank their answer on a 5 tier scale, ranging from Strongly Up, Slightly Up, About The Same, Slightly Down and Strongly Down. This information is then collated to provide the basis for our proprietary index system.
The index gives a measure of vendors’ expectations for home price movement on a scale of -10 to +10, with a reading of 0 being a neutral view of the market. Values above +5 indicate strong overall optimism and values below -5 indicate strong overall pessimism.
All of our responses have been weighted against the relevant cohorts at the state level to remove any bias and present a realistic snapshot of sentiment for that group. Using this methodology, we ensure that the Consumer Sentiment Index is relevant for all vendors, not just OpenAgent’s customers.
National Consumer Sentiment
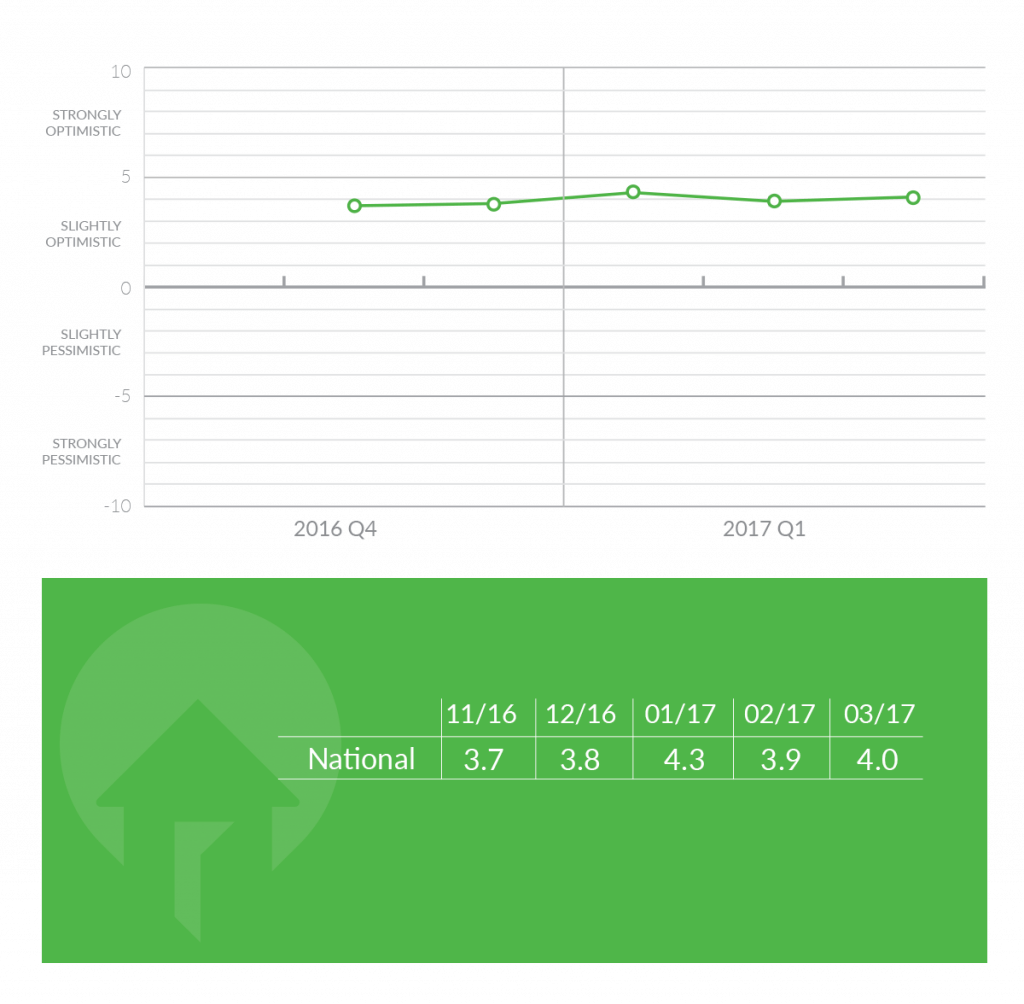
On a national basis, consumer sentiment was the highest at the start of the first quarter of 2017, with January recording a reading of +4.3. This represented a rise of over 16% from November 2016, and demonstrates general consumer enthusiasm at the start of the new year. This fell in February, before recovering somewhat in March to close at a reading of +4.0.
The most common reason that people expected house prices to rise over the report period were: many people moving into my area (43%), new developments (33%), state of jobs and the economy in my area (13%) and a trend I’ve observed in the market (8%).
The most common reason that people expected house prices to stay the same or fall over the report period were: state of jobs and the economy in my area (46%), oversupply of housing (21%), a trend I’ve observed in the market (12) and the area isn’t that popular (6%).
State Consumer Sentiment
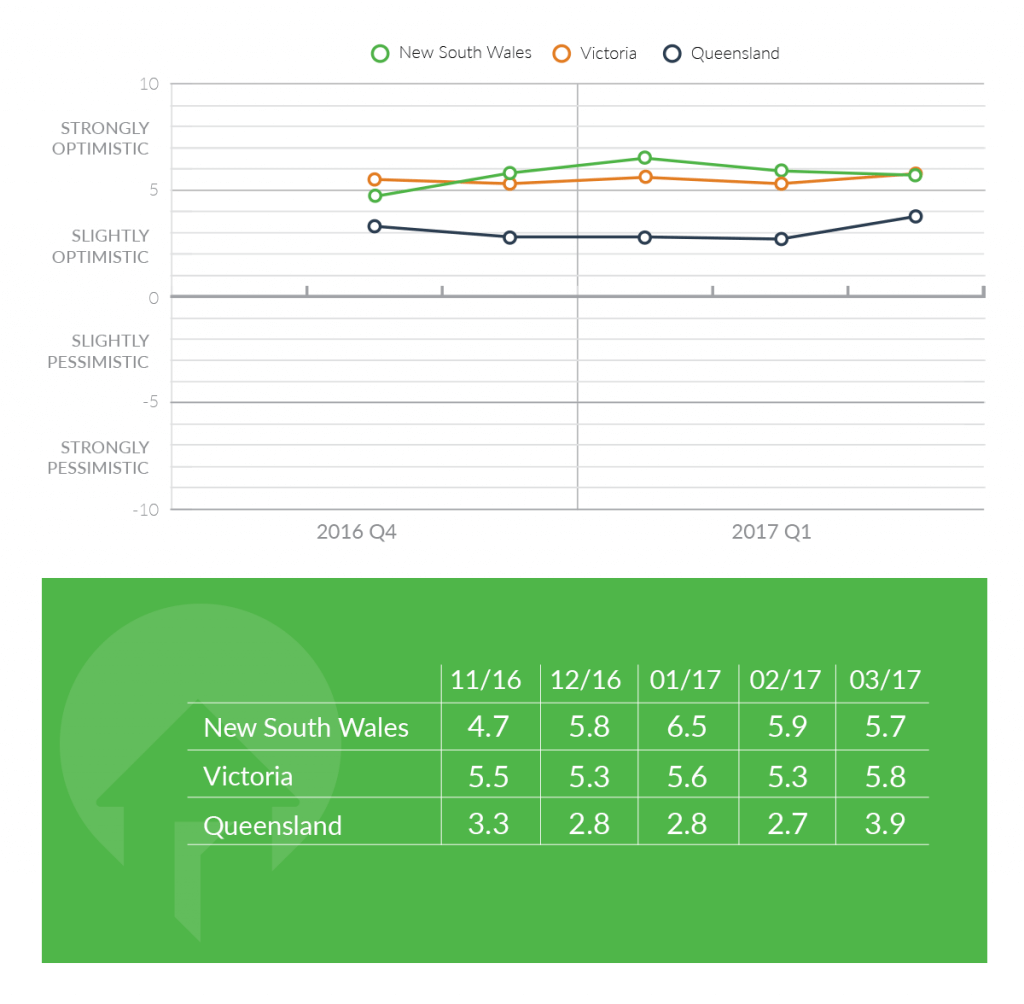
On a state by state basis, New South Wales recorded the largest single positive reading, polling a +6.5 in January this year. This represented a significant increase on 4Q16 from the reading of +4.7 taken in November 2016. These gains reversed in February and March, with the NSW state index falling 12% from the January peak to +5.7 at the end of March.
This muted finish to 2017 Q1 was not matched in Victoria, where the Consumer Sentiment index recorded its highest rating of +5.8 in March this year. This marked a 9% month-on-month increase from February, where the reading was at its equal lowest state level of +5.3 (which it also recorded in December 2016). Victoria proved to be the most consistent of the three states measured over the two quarters.
It was another story in Queensland, where readings were the lowest of the three biggest states. The index opened with a modest reading of +3.3 in November 2016, before slumping to +2.8 in December. The New Year did not produce the same optimism as in the state’s southern counterparts, with January holding steady and February falling to +2.7, the single lowest reading of the three biggest states. Interestingly, this trend sharply reversed in March, with the reading rocketing up 44% to +3.9.
Metro vs. Regional Consumer Sentiment
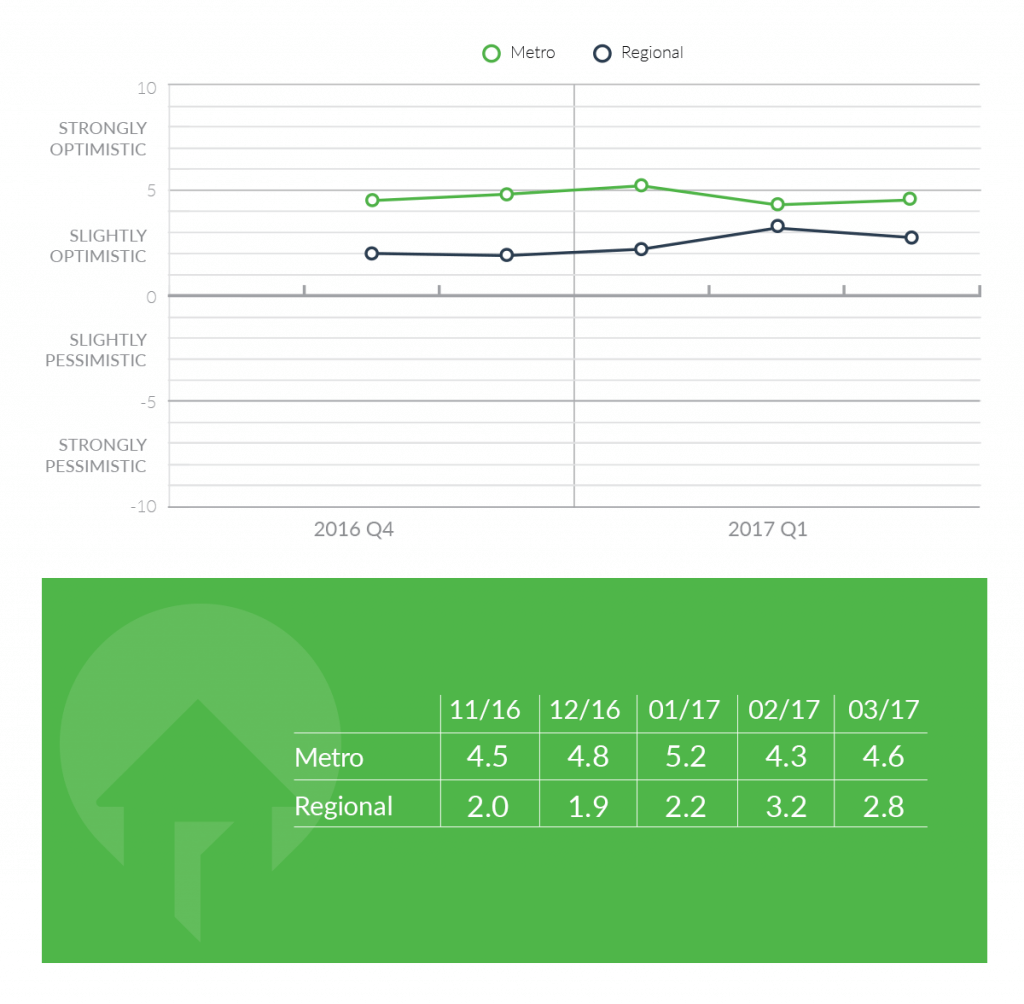
OpenAgent is proud to serve homeowners in regional Australia, and our national coverage has allowed us to compare the views of those in the city against those in the country.
Unsurprisingly, the city consumers were positive over every month in the report period, with readings in excess of those at the aggregated national level. The highest level of positive sentiment was recorded in January, as the optimism of the New Year drove the rating into strong territory at +5.2. This trend reversed in February, where the reading dropped to +4.3, before recovering to close the quarter at +4.6.
Regional consumers were markedly less optimistic than their metro counterparts, with values around +2 through the Christmas and New Years period. The higher index values in February (+3.2) and March (+2.8) may indicate a positive shift in sentiment across the non-metro areas of Australia.
Capital Cities
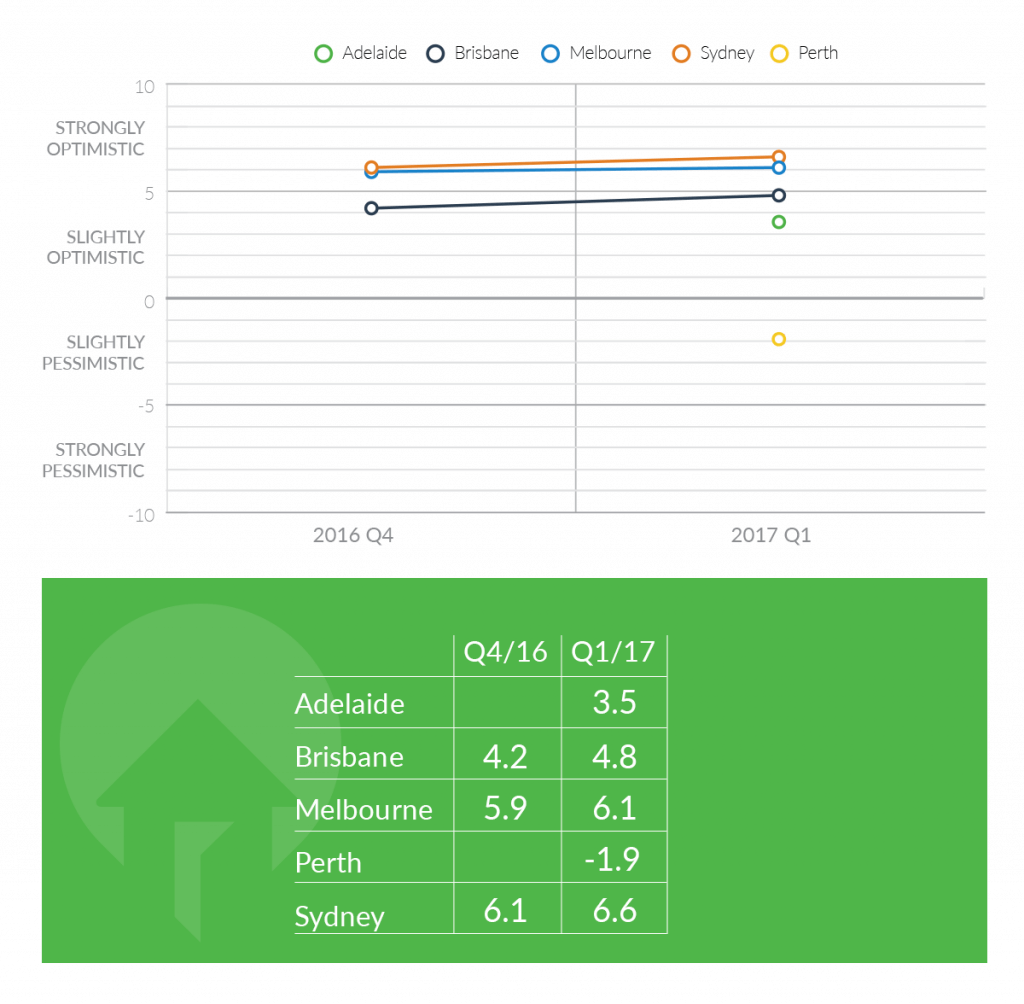
Examining the individual metros on a quarterly basis, Sydney was the standout of the major capital cities on a quarter-on-quarter view, rising from an already strong +6.1 in 2016 Q4 to +6.6 in 2017 Q1. This positive momentum was also seen in Melbourne, rising from +5.9 to +6.1, and Brisbane, which increased from a lower base of +4.2 to +4.8. These metrics confirm the strong optimism on display in the booming markets of Sydney and Melbourne.
Readings for Adelaide and Perth were only available in 2017 Q1, which nevertheless made for interesting reading. While Adelaide recorded a relatively subdued level of +3.5, it was Perth that proved to be the outlier, polling a reading of -1.9. The effects of the end of the mining boom were clearly evident, with the biggest single reason for negative price expectations being state of jobs and the economy in my area. This is consistent with prior industry reporting and highlights the plight of Perth vendors in the current market, many of whom are anticipating price falls.
Investors vs. Owner Occupier Sentiment
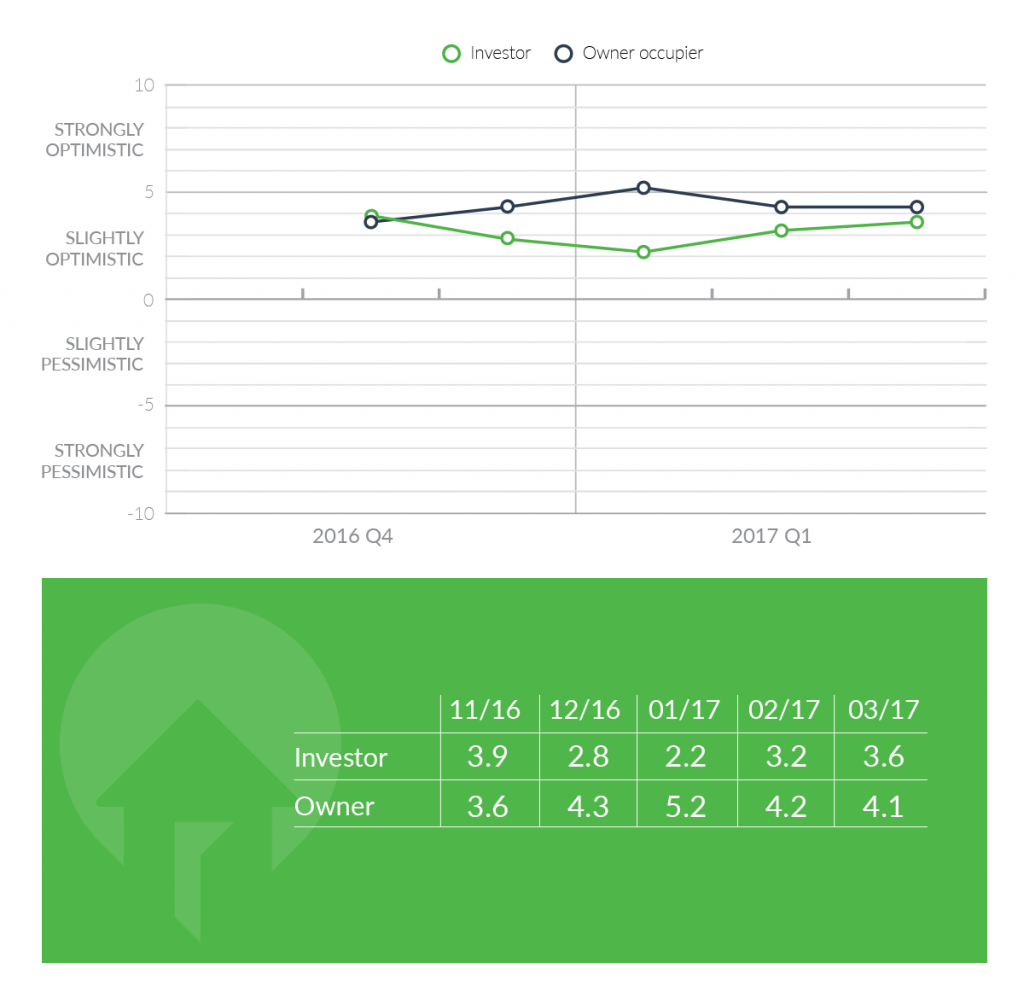
One of the most interesting comparisons in sentiment produced by the inaugural survey appears to be between vendors who classify themselves as owner occupiers versus investors. Firstly, owner occupiers were on the whole more optimistic about house prices than investors, with an average index over the report period more than 1 point higher than investors. In addition, the movement in sentiment over the 5 months from November 2016 to March 2017 diverge significantly between the two groups. Where investors began confidently at +3.9 in November, this fell leading into the New Year and bottomed in January at just +2.2, before rising again to +3.6 in March. Conversely, owner occupiers began at their lowest level of sentiment of +3.6 in November, before rising to a high of +5.2 in January, and eventually settling at +4.2 in February and +4.1 in March. We are eager to see if this trend of divergence continues in future reports.


