Australian property prices rise at fastest rate in 17 years
Australian property prices have risen at the fastest rate since August 2003, with every capital city and rest of the state regions posting gains over February.
National property values: February 2021
| Median property value | Monthly change | |
| Houses | $624,250 | +2.3% |
| Units | $537,106 | +1.3% |
The latest CoreLogic data reveals national home values had the largest month-on-month increase in 17 years, surging +2.1 per cent to a median of $598,884.
CoreLogic research director, Tim Lawless, describes the Australian housing market as “in the midst of a broad-based boom” and attributes the growth to record-low interest rates, improving economic conditions, government stimulus and low levels of properties on the market.
Mr Lawless also comments on the unique nature of the upswing that has seen property prices rise across all capital cities and regions.
“The last time we saw a sustained period where every capital city and rest of the state region was rising in value was mid-2009 through to early 2010, as post-GFC stimulus fueled buyer demand,” he said.
The mismatch between housing supply and demand continues to be the driving force behind higher property prices. The latest figures show that the number of properties advertised for sale nationally remains -26.2 per cent below 2020 levels.
Mr Lawless says that FOMO (fear of missing out) has returned to the property market as buyers compete for the limited properties for sale.
“Housing inventory is around record lows for this time of the year and buyer demand is well above average. These conditions favour sellers.
“Buyers are likely confronting a sense of FOMO which limits their ability to negotiate. Vendor discounting rates were estimated at a record low of 2.6 per cent in February, and auction clearance rates have consistently been in the high 70 per cent to low 80 per cent, which is well above average,” he said.
The latest ABS lending data supports this trend with figures showing new home loan commitments continuing on their record run, growing for the eighth consecutive month and reaching another record high.
Owner-occupier loans increased 10.9 per cent in January 2021 and a whopping 52.3 per cent over the year.
Investor activity is also ramping up, rising 9.4 per cent over January. ABS Head of Finance and Wealth, Katherine Keenan said that this is the largest rise since 2016.
“Investor lending has rebounded 62.4 per cent since reaching a 20 year low in activity in May 2020,” she said.
Sydney and regional NSW
| Median property value | Monthly change | |
| Houses | $1,061,229 | +3.0% |
| Units | $738,254 | +1.2% |
Over the month, Sydney was among one of the strongest performing markets, rising +2.5 per cent to a median value of $895,933.
Sydney houses performed exceptionally well, increasing +3.0 per cent over February, the highest house growth of all capital cities.
Sydney units are finally showing early signs of recovery, recording its first month of growth since April last year, up +1.2 per cent.
Tim McKibbon, Chief Executive Officer of REINSW is confident the NSW property market will remain strong, commenting on the competitive auction activity over the past few months.
“CoreLogic figures released today show values continued their upward trajectory in February and we’re expecting another week of strong sales ahead.
“Clearance rates this weekend should again sit around the 80 per cent mark,” he said
Over the longer term, Sydney property prices are still holding steady, up +2.8 per cent over the past 12 months.
Regional NSW property prices
| Median property value | Monthly change | |
| Houses | $546,986 | +2.3% |
| Units | $442,250 | +1.8% |
Regional NSW values continued to grow over February, with an increase of +2.2 per cent over the month. This brings the median value of a property to $527,673.
Houses outperformed units, rising +2.3 per cent compared to +1.8 per cent for units.
Having recorded less of a decline in housing values through the worst of COVID-19 over the past year, regional NSW properties are up an impressive +11.0 per cent over the last 12 months.
Melbourne and regional VIC
| Median property value | Monthly change | |
| Houses | $829,509 | +2.4% |
| Units | $582,833 | +1.2% |
After weaker performance throughout 2020, the Melbourne property market is catching up with the latest figures showing property prices increasing +2.1 per cent over the month. This brings the median value to $717,767.
Auction activity is ramping up in Melbourne with 1,273 homes taken to auction in the week ending the 28th of February 2021. Preliminary clearance rates were reported at 77.7 per cent.
This is compared to the 74.8 per cent clearance rates over the same week last year across 1,612 auctions.
As buyer competition increases and property prices rise, investors are making a comeback with the latest ABS lending figures revealing a +12.9 per cent increase in new loans to investors in January.
Regional VIC property prices
| Median property value | Monthly change | |
| Houses | $459,787 | +2.6% |
| Units | $323,391 | +2.8% |
Regional VIC house values performed strongly over the month, rising +2.6 per cent to a median of $436,154.
Units have bucked the trend, performing better than houses. They climbed +2.8 per cent over the month compared to a slightly lower +2.6 per cent increase for houses.
Over the past 12 months, regional VIC property values are up +8.3 per cent.
Brisbane and regional QLD
| Median property value | Monthly change | |
| Houses | $593,232 | +1.6% |
| Units | $396,183 | +1.0% |
Brisbane property prices rose +1.5 per cent over the month to a median of $535,618.
Houses performed better than units over February, up +1.6 per cent compared to +1.0 per cent increase in value for units.
Auction activity has been strong in Brisbane with 115 auctions in the week ending February the 28th, returning a preliminary clearance rate of 79.0 per cent.
Over the same week last year, a 60.5 per cent clearance rate was reported for 136 auctions.
Regional QLD property prices
| Median property value | Monthly change | |
| Houses | $432,348 | +1.9% |
| Units | $393,579 | +1.9% |
Dwelling values in regional QLD continue on an upward trend, increasing +1.9 per cent over the month - bringing the median value of property to $421,432.
Over the past 12 months, prices have also trended up and are +9.2 per cent higher.
Regional QLD houses and units performed similarly over February, both growing +1.9 per cent.
Hobart and regional TAS
| Median property value | Monthly change | |
| Houses | $572,188 | +2.5% |
| Units | $421,143 | +2.3% |
The Hobart property market was a top performer over the month, rising a strong +2.5 per cent to a median of $535,994.
Both Hobart houses and units performed well, with houses climbing +2.5 per cent to $572,188.
Hobart units recorded the highest month-on-month increase of all the capital cities, up +2.3 per cent to a median of $421,143.
Over the past 12 months, Hobart properties have risen +8.7 per cent.
Regional TAS property prices
| Median property value | Monthly change | |
| Houses | $372,657 | +2.9% |
| Units | $277,696 | +0.6% |
Regional TAS property prices were the strongest of all the state regions over February, climbing an impressive +2.7 per cent to a median of $358,415.
Houses strongly outperformed units, rising +2.9 per cent compared to +0.6 per cent for units.
Over 12 months, prices have risen a whopping +13.8 per cent.
Canberra and the ACT
| Median property value | Monthly change | |
| Houses | $797,421 | +2.2% |
| Units | $479,934 | +0.7% |
Canberra property prices have increased +1.9 per cent over the month to a median of $706,454.
Canberra houses rose +2.2 per cent to a median of $797,421. Canberra units rose a more mild, +0.7 per cent to a median of $479,934.
In the auction market, buyer activity is strong. In the week ending 28th February 2021, 112 Canberra auctions returned a preliminary clearance rate of 84.7 per cent.
Over the same week last year, a lower clearance rate of 69.5 per cent was reported for a lower volume of 83 auctions.
Over the past year, Canberra prices have grown a substantial +9.7 per cent.
Adelaide and regional SA
| Median property value | Monthly change | |
| Houses | $509,148 | +0.8% |
| Units | $349,913 | +0.5% |
Adelaide home values rose +0.8 per cent in February to a median of $478,587.
Adelaide houses grew the least of all the capital cities, increasing +0.8 per cent to a median of $509,148.
Units also experienced more subdued growth, up +0.5 per cent to a median of $349,913.
Over the longer term, Adelaide property values have risen +2.7 per cent over the past three months and +7.3 per cent over the past year.
Regional SA property prices
| Median property value | Monthly change | |
| Houses | $263,189 | +2.0% |
| Units | $211,709 | +2.8% |
Over the month, regional SA properties rose +2.0 per cent to a median of $258,068.
Units outperformed houses, up +2.8 per cent compared to a +2.0 per cent increase for houses.
Regional SA housing values have climbed +6.5 per cent over the past three months and +11.5 per cent over the past year.
Perth and regional WA
| Median property value | Monthly change | |
| Houses | $513,566 | +1.6% |
| Units | $374,053 | +1.2% |
Perth property prices continued on their upward trajectory over February, recording growth for the sixth month in a row.
Perth property values increased +1.5 per cent over the month to a median of $513,566.
Breaking down dwelling performance, Perth houses rose +1.6 per cent to a median of $513,566 while units rose +1.2 per cent to a median of $374,053.
According to the Real Estate Institute of Western Australia (REIWA) President Damian Collins, in February Perth sales listings dropped to a 10 year low due to demand.
“We’ve seen an extraordinary decline in listing volumes in a relatively short amount of time.
"In the span of a year, listings have dropped 36.5 per cent to now sit below 8,000 for the first time in about a decade. Buyers are very active in the market and soaking up stock at a rapid pace," he said.
Mr Collins said that 50 perth suburbs saw their median sale price increase in February with the biggest increases in East Fremantle (up 5.7 per cent), South Yunderup (+5.2 per cent), Seville Grove (+3.0 per cent), Cloverdale (+2.7 per cent) and Ballajura (+2.5 per cent).
Regional WA property prices
| Median property value | Monthly change | |
| Houses | $360,861 | +1.2% |
| Units | $228,639 | -1.7% |
Regional WA property prices rose +1.0 per cent to a median of $347,031 over the month.
House and unit performance diverged in February with house prices rising +1.2 per cent while units declined -1.7 per cent.
Regional WA housing values have risen +4.3 per cent over the past three months but are still in the negative over the longer term, down -1.5 per cent over the past 12 months.
Darwin and regional NT
| Median property value | Monthly change | |
| Houses | $508,410 | +1.3% |
| Units | $289,789 | -0.6% |
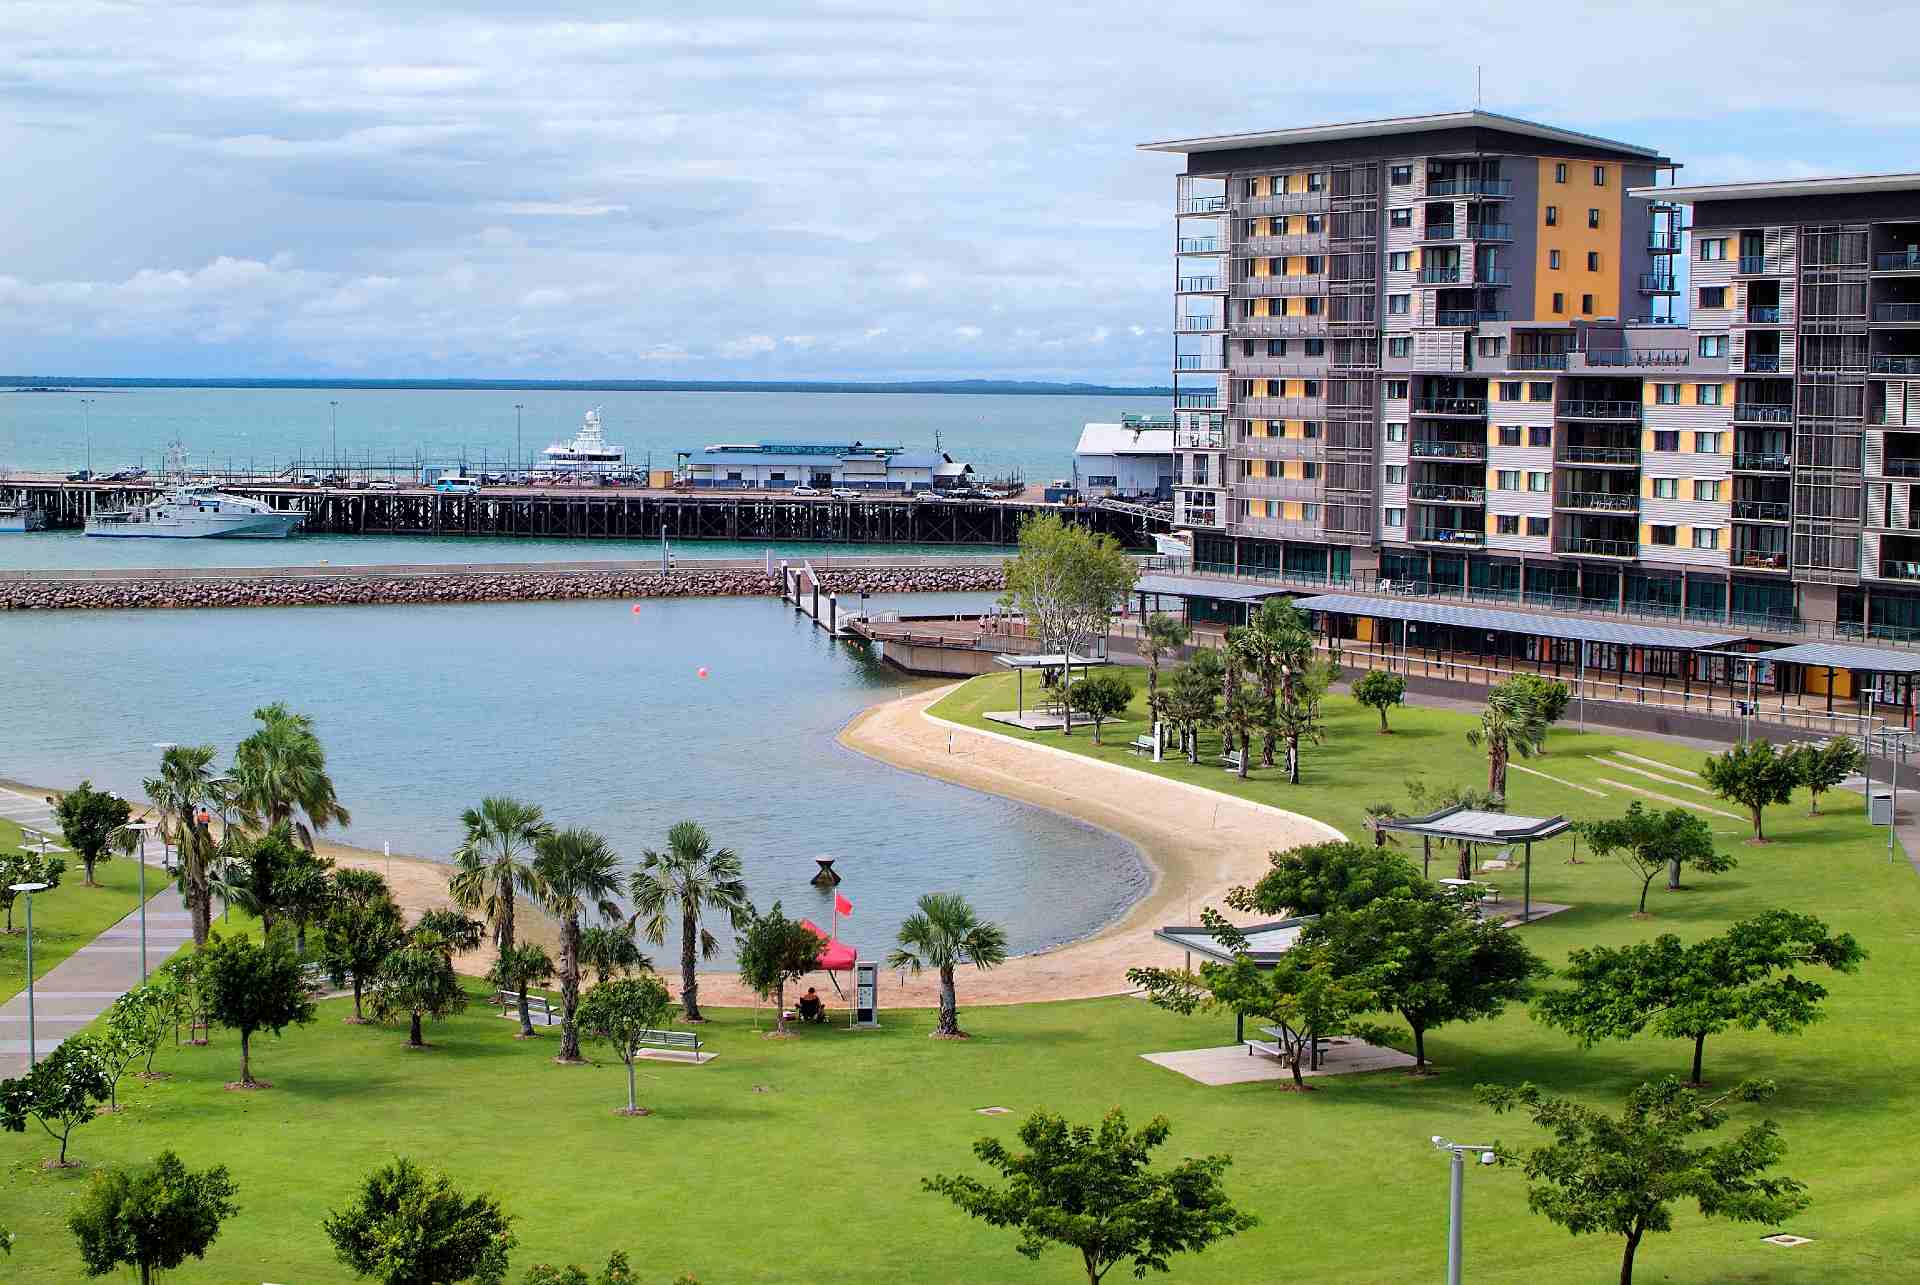
Darwin property prices increased +0.7 per cent in February to a median of $438,645.
Darwin houses rose +1.3 per cent to a median of $508,410 while units declined -0.6 per cent to $289,789.
Darwin properties have grown the most of all the capital cities over the past 12 months, with double digit growth of +13.8 per cent.
This is likely due to increased interstate migration spurred on by the influx of demand for houses and increased ability to work remotely.
Regional NT property prices
| Median property value | Monthly change | |
| Houses | $440,571 | +1.1% |
| Units | n/a | n/a |
Regional NT house prices rose +1.1 per cent over the month to a median of $440,571.
Over the past three months, regional NT property prices have risen +4.2 per cent and +0.6 per cent over the year.
Rental market update
Rental markets across Australia have been extremely varied. The cities of Perth and Darwin where rental conditions are tight, have had the highest rental growth for both houses and units.
Annual rental growth for Perth and Darwin houses are both above 13 per cent for houses and above 10 per cent for units.
The rental markets in Sydney and Melbourne on the other hand have declined over 2020, especially in the unit sector where Sydney unit rents are down -5.3 per cent, with Melbourne unit rents down -8.0 per cent..
According to CoreLogic’s Tim Lawless there is a reason for the disparity between these markets.
“The strength in Perth and Darwin’s rental sector can be attributed to a mix of low supply, due to a recent history of low investor participation, and rising demand as interstate migration trends move into positive territory.
“The opposite trends in Sydney and Melbourne have seen rental markets weaken; higher rental supply due to a recent history of investor exuberance, weaker demand from negative interstate migration and, more recently, a demand shock from closed international borders,” he said.
The good news for Sydney and Melbourne investors is that the rental market is showing some signs of recovery with Sydney’s rental index for units recording two consecutive months of mild rises and Melbourne unit rents edging higher after months of decline.
Mr Lawless believes this rise could be attributed to more people returning to work in the inner cities as well as industries such as hospitality, food and accommodation services returning to employment.
In our capital cities, the highest rental yield is in Darwin at 6.2 per cent and in our regional markets, regional NT has the highest yield at 7.0 per cent.
The national gross rental yield sits at 3.6 per cent.
What does this mean for the Australian property market? What is the outlook for the months ahead?
The Australian housing market is in one of the strongest growth phases on record due to record low interest rates, strong economic conditions and supply unable to fulfil market demand. Not to mention the extraordinary government intervention and stimulus which has played a huge role in protecting the housing market.
While there are concerns that the wind down of government stimulus this month will have an impact on the housing market, it looks to be unlikely.
Westpac economists are forecasting continued growth in property values, predicting 20 per cent growth nationally over the next two years.
In their report, economists Bill Evans and Matthew Hassan forecast strong performance in our larger markets once borders open.
“The smaller capital cities and regions are well placed to continue to outperform in 2021 but growth will swing towards the three eastern capitals - Sydney, Melbourne and Brisbane in 2022 as the end of the pandemic allows international borders to reopen,” they said.
CoreLogic’s head of Australian research Eliza Owen comments on what would be needed to slow down the rate of growth.
“We’d either need to see more restrained lending conditions or higher levels of supply to really start to ease the growth that we’re seeing in the housing market at the moment,” she said.
While CoreLogic does expect to see a substantial lift in listing numbers in March, it may not be enough to satisfy demand.
“Although new listings are likely to track higher over coming months, if buyer demand continues to lift it’s likely overall advertised stock levels will remain low.
“Serious buyers would be well advised to have their financing pre approved and be ready to act fast in order to secure a property under such tight supply conditions.” Mr Lawless said.


