What suburbs are booming and cooling in NSW - 2018?
Want to know which suburbs are set to boom and cool in NSW as we move into 2018?
By all accounts you should be prepared for slowdown in the housing market, even though the projections forecast NSW to deliver modest capital growth for all dwelling types. Like any market this will vary across the state and suburb-by-suburb, based on the property type and a range of other factors.
First let's take a look at what a 'boom' market actually is.
What is a 'boom' market?
Booms occur where property values rise sharply or for a sustained period, typically over a few years. These are typically high demand for a relatively small number of properties. A boom can often lead to a housing bubble, where speculation starts to drive demand.
The intrinsic value of properties becomes artificially inflated to unsustainable levels. The bubble or crash occurs when demand ceases suddenly, at the same time as supply increases. True property booms are actually quite rare as extraordinary conditions need to be in place for them to occur.
The last significant boom in Australia occured in the 1990's, when a combination of low interest rates and government stimulus - the First Home Owner Grant - led to a doubling of house prices in just a few years.
The recent price growth in property we have experienced in NSW has not been as dramatic, and is part of the typical property cycle. This is characterised by a value phase, growth phase, market peak and correction/cooling phase. Many analysts believe we are now entering the correction or cooling phase - where dwelling prices stagnate or moderate.
What causes a market to cool?
When house prices begin to drop or grow at more moderate levels the term for this is a cooling market. A number of factors can cause this, including:
Tighter lending criteria and credit policy from major lending institutions
A rise in interest rates, which makes borrowing more expensive
Housing affordability, specifically the ability of first home buyers to enter the market
A drop in wages, as people have less income to invest in property
Major changes in legislation, specifically to tax regimes and/or government grants
A reduction in population growth, which leads to fewer buyers in the market
Sydney market goes off the boil
If there is one thing all analysts agree on, it is that a slowdown is expected to define the national housing market in 2018.
In NSW this is especially true for Sydney, which by value and transactions dominates the state's property market. Here affordability - more suburbs now have a median house value in excess of $1 million than not - and tighter lending restrictions cooled the market in mid-2017.
According to CoreLogic, Sydney property prices softened 0.9% in the month of December to be 2.1% lower over the quarter, with SQM Research's Louis Christopher predicting Sydney will grow at a more measured 4 to 8 per cent in 2018.
BIS Shrapnel are more pessimistic predicting a decline of 5% from June 2017 levels, and cite new apartment oversupply as the primary factor. BIS Shrapnel forecasts median house price growth in Sydney to weaken into 2018 due to lower investor activity in the market. It goes so far to predict negative growth of -3.8 per cent for 2017-2020, with -0.6 per cent growth projected for 2018.
Another key property market indicator that is pointing to a cooling Sydney market is the days on market metric. Homes took 42 days to sell in December 2017, where they were on the market for just 29 days back in February 2017. With property prices now falling, this metric is one to watch, and is likely to trend higher as 2018 progresses.
What NSW suburbs are cooling and booming in 2018?
Cooling NSW suburbs
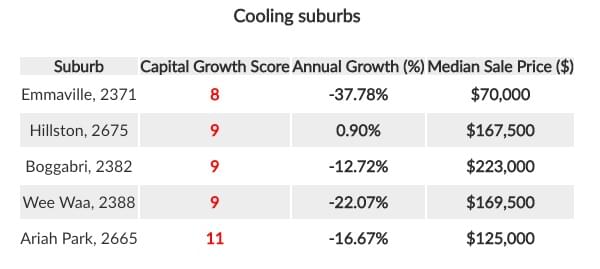
According to PropertyValue.com.au, the top cooling suburbs for houses are Emmaville, Hillston, Boggabri, Wee Waa and Ariah Park, all recording Capital Growth Scores of under 12*.
When it comes to the Sydney market, it will by all accounts cool in 2018, but which suburbs are particularly at risk?
A striking change are the whispers about apartment oversupply have now become more vocal concerns. Property analysts RiskWise identified a number of blacklisted suburbs in NSW in danger of experiencing a decline in apartment prices.
They are Zetland, Holroyd, Epping and Schofields, and go onto point out that there are, “more than 315,000 units...approved for construction over the next two years” in the city.
BIS Oxford Economics reports that rental yields for units in Sydney have fallen to a 12 year low, down to 3.57 per cent from a high of 4.95 per cent in 2009. This metric is often an indicator that prices will cool in the near future. They also note that any suburb with a median house price in excess of $1 million - which is much of Sydney - is likely to experience a cooling in 2018.
The good news is that regional NSW is not only more affordable, it also offers better returns than the bright lights of Sydney.
Booming NSW suburbs
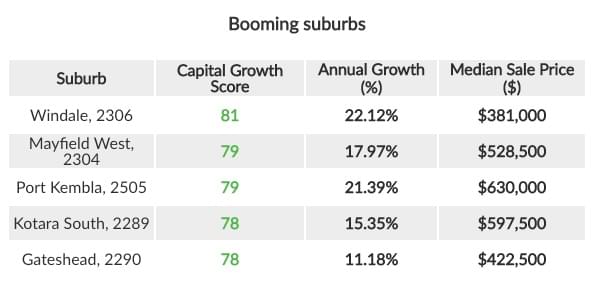
With affordability pushing buyers away from Sydney, regional NSW is the primary beneficiary with locations like the Illawarra recording strong growth in 2017. According to PropertyValue.com.au, the top suburbs with the highest Capital Growth Scores* for houses are Windale, Mayfield West, Port Kembla, Kotara South and Gateshead.
Corelogic has previously reported the Illawarra region as one of the countries top regional performers, with house and unit values increasing by 13 per cent and 17 per cent respectively for the September quarter.
Port Kembla was a standout performer posting year on year growth of 21.3 per cent, with Shoalhaven another strong performer, posting gains of 19.5 per cent over the same timeframe. Regional cities like Newcastle have also recorded solid gains, where the suburb of Windale posted median price growth of 22.1 per cent over the last year.
If you are set on buying in Sydney then you need to look at new centre's of growth like Parramatta, or the city's western suburbs where some postcodes still have median prices well below the metro average.

Data-driven property investment
Data, and big data are buzzwords in all sectors, and property is no exception. Using data to inform your overall investment strategy is the smart way to go about approaching property investment. Relying on gut instinct or a tip you heard about at a barbecue cannot really compete with analysing key property market indicators. These can give you real insights about a market's performance, by looking at:
Property values, where rising house prices could indicate a positive long term trend
Clearance rates, where high percentages indicate a 'hot' market
Days on market (DOM), where low DOM would indicate a 'hot' market, and longer DOM could indicate a 'slow' market.
Rental yields, which details how much income/rent a property could fetch over a timeframe, as a proportion of its value.
Vacancy rates, with high rates a sign there is reduced tenant demand or a glut of rental properties on the market.
Ultimately you will also need to look at other market conditions such as interest rates, housing approvals, employment data and other macroeconomic conditions which can all influence property values. This will help you identify which suburbs are set to boom or cool.
*Capital Growth Score - The Suburb Capital Growth Score is the average of all the individual Capital Growth Scores for each property in that suburb. Capital Growth Scores for individual properties are generated according to three factors: change in median price (1 year), average days on the market and average vendor discounting. A higher Suburb Capital Growth Score indicates the suburb has recently experienced significant capital growth and the short term outlook for further growth is likely to be strong given strong market health indicators.


