Property Clock: Which markets will boom or bust?

Tracking the housing market is anything but straightforward — and calling the next move is tougher still.
Each month, independent valuer Herron Todd White maps Australia’s 50 biggest markets on its Property Clock, showing who’s rising, peaking, cooling or bottoming out in the cycle. 
So where does your market sit right now? Dive into their latest Property Clock to see what the next few months could hold.

Get a free property value estimate
Find out how much your property is worth in today’s market.
Markets on the rise
Conditions across the country have grown more mixed, with affordability pressures and another round of interest rate rises driving a multi-speed market.
Even so, selling conditions remain broadly favourable, which is why the majority of markets still sit in the rising half of HTW's Property Clock.
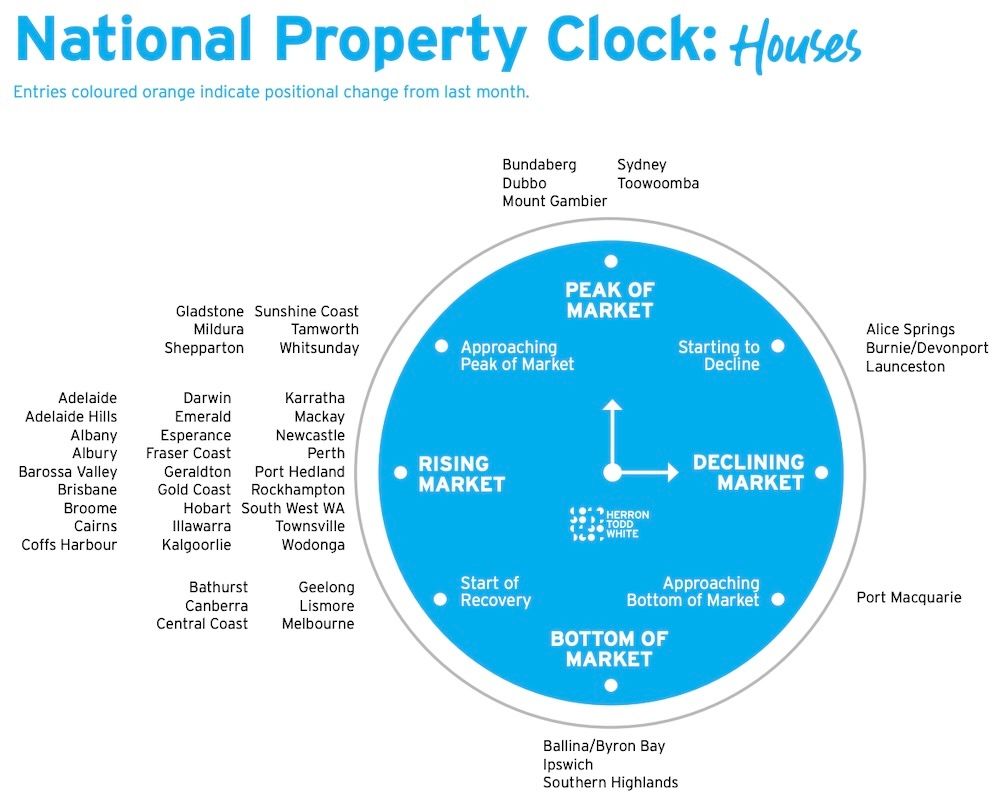
Houses in Melbourne, Canberra, Bathurst, Geelong and the NSW Central Coast are all considered to be at the start of their next upswing.
Melbourne's position is worth calling out. Cotality's most recent figures still have its values falling rather than climbing, so HTW's placement reads more as a call on where they see the cycle heading than a reflection of current prices.
Hobart, Newcastle and the Illawarra continue to sit among the rising markets, the largest segment on the clock.
They are joined by the capital cities of Brisbane, Perth, Adelaide and Darwin, each continuing blazing runs of growth.
Since our last update, Coffs Harbour has also stepped up into the rising group.
Alongside them is a long list of regional performers, with particularly strong representation across Queensland that includes the Gold Coast, Cairns, Townsville, Rockhampton and Mackay, plus Albury and Wodonga on the southern border.
Markets at or approaching their peak
The clearest change since we last looked sits at the top end of the clock.
Sydney has moved up into the peak of market segment, after spending the previous update merely approaching it.
Burgeoning Queensland markets like the Sunshine Coast, Gladstone and Whitsunday remain in the approaching-peak group, and Shepparton has now joined them.
Tamworth, meanwhile, has eased back off the peak on the house clock to sit just below it.
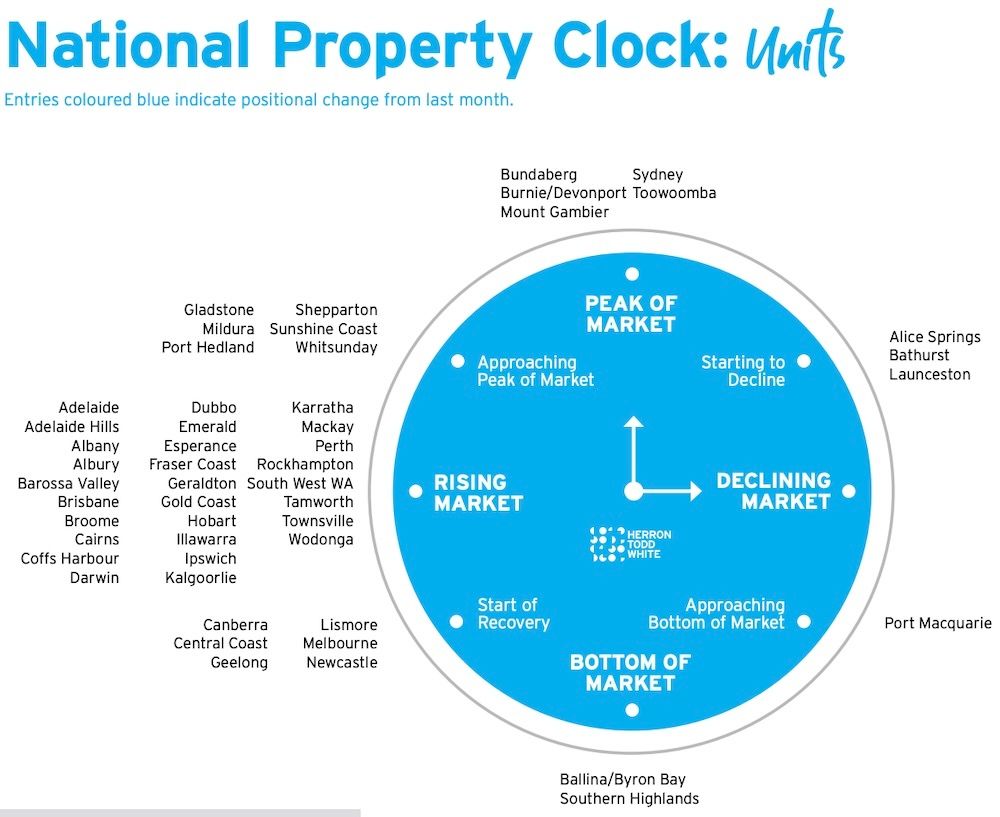
As for the markets HTW considers to be right at their peak, Sydney now sits among a cluster of regional economic centres including Bundaberg, Toowoomba and Mount Gambier. Dubbo joins them on the house clock, while Burnie/Devonport sits at the peak on the unit clock.
Markets declining or at the bottom
The right-hand side of the clock remains far sparser, with only a handful of markets tipped to fall or hover near the bottom.
On the unit clock, Alice Springs, Bathurst and Launceston are listed at the beginning of a downswing. The house clock has Burnie/Devonport in that group in place of Bathurst.
Notably, not one city is classed as a firmly declining market.
Port Macquarie on the NSW mid-North Coast is again the sole market deemed to be nearing its lowest point.
As for markets considered to be firmly at the bottom, Ballina/Byron Bay and the Southern Highlands are joined by the Ipswich house market.

A different perspective from Domain
Mid-way through the year, Domain recently released their Housing Market Forecast Financial Year 2026 report and included a property clock of their own.
The graphic, which only looks at the six most populous capital cities, paints a somewhat different picture to HTW's outlook.
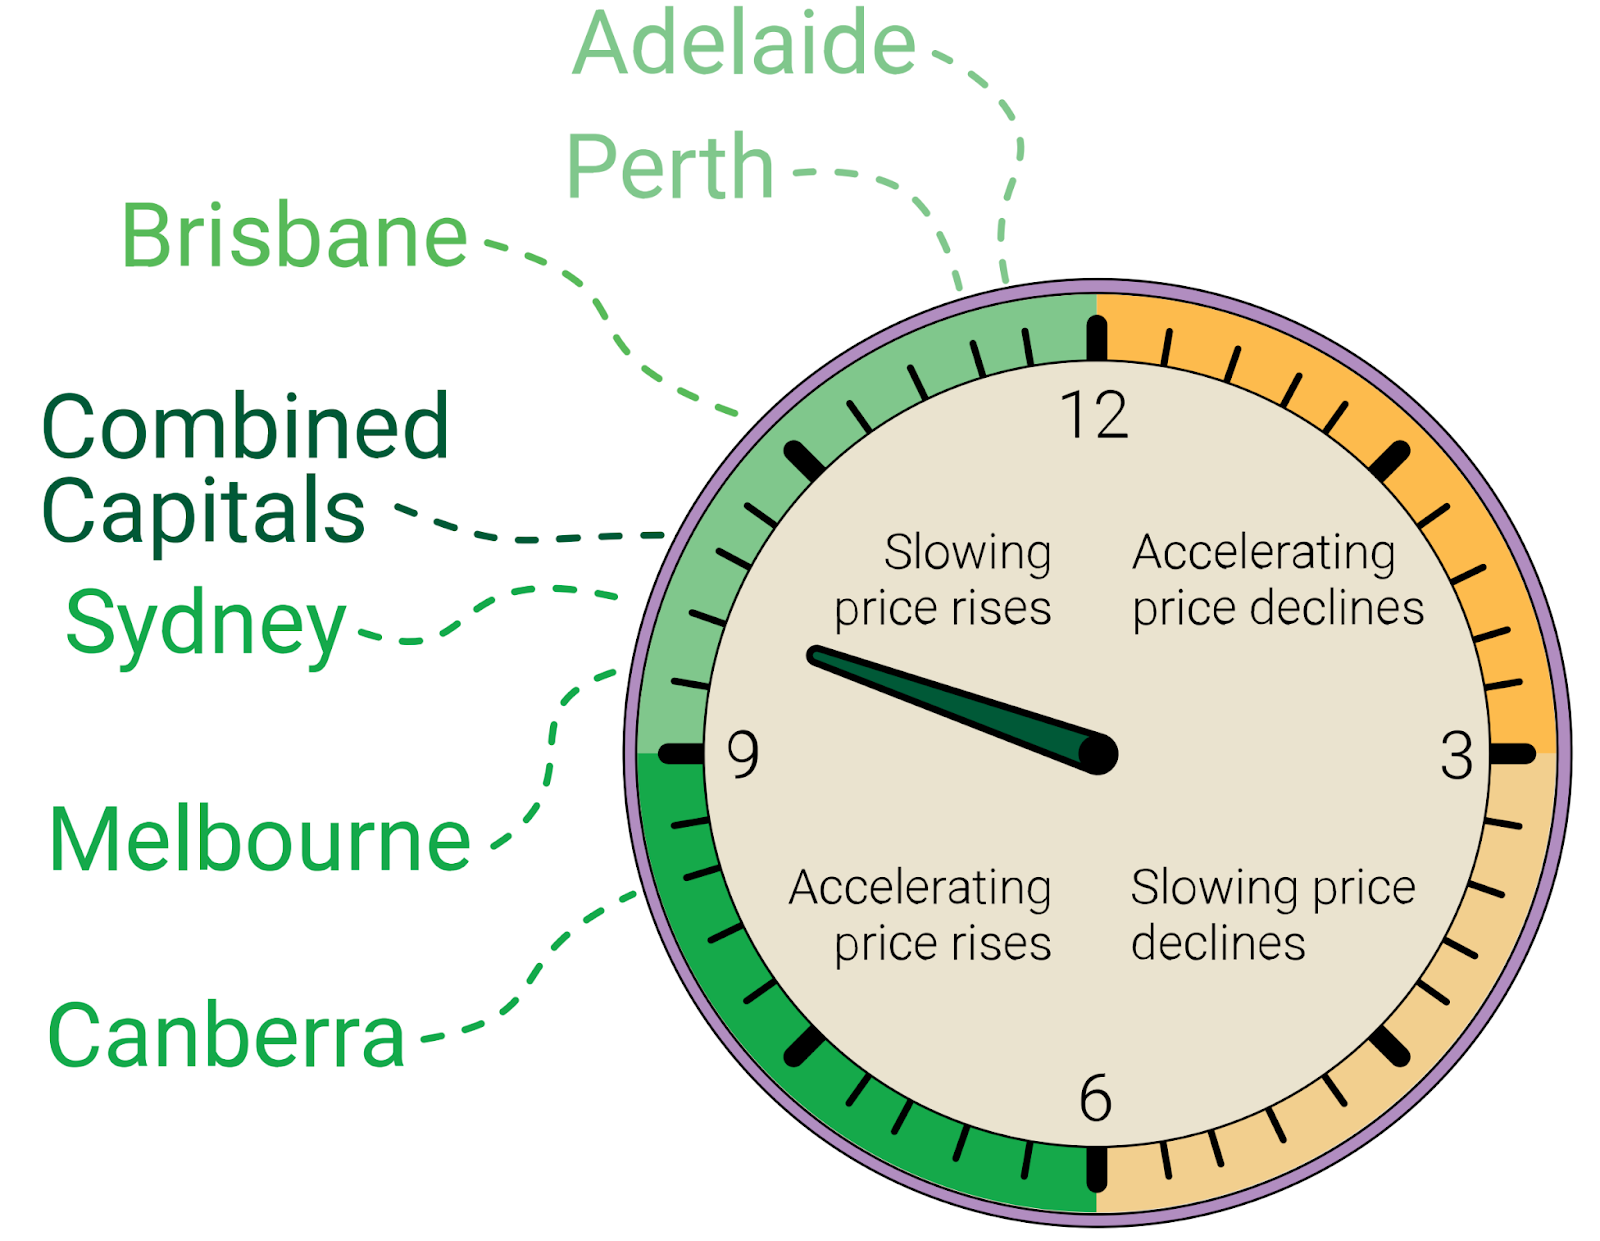
According to Domain, Canberra is positioned to speed up considerably, while Melbourne and Sydney are tipped to ease.
Perhaps most interestingly, Domain's position is that the three mid-sized capitals of Brisbane, Perth and Adelaide are on the verge of winding down after years of outsized growth.
Thinking of selling?
If you're looking to get in on the action in 2026, it's important to be as prepared as possible in order to cut through the competition and achieve a standout result.
Step 1: Understanding how your market is performing
Every market is different, and understanding your local market is fundamental to making the right selling decisions. Our guide to tracking market trends and data will help you to get a clear picture of how your market is performing and how that impacts you as a seller.
Step 2: Know what your property might be worth
Getting a free home value estimate is a great way to set a foundation for your selling expectations and begin planning the path forward.
Step 3: Get a no-obligation market appraisal from a top real estate agent
Understand what your property could sell for in the current market by speaking to the top-performing agents in your suburb. Comparing top agents in your area will help you find the perfect partner for your selling journey and move towards a successful result.
Step 4: Finally, get your property listing ready
Taking a thorough approach to preparing your home for sale is another critical step. From cleaning, decluttering, painting and performing other cosmetic renovations to home staging, photography and marketing, getting your property to sale-ready condition is a must.